

Atomic Mapper
The Atomic Mapper is a Python-based standalone software for atomic-scale mapping of high-angle annular dark-field (HAADF) scanning transmission electron microscopy (STEM) images using the Z-contrast method. It utilizes multiple open-source packages: NumPy, OpenCV, SciPy, HyperSpy, Matplotlib, and scikit-learn. The Atomic Mapper is designed to simplify the analysis of STEM images by extracting of positions of dumbbells and atomic centers within the whole image during a single calculation run.
The program supports a wide variety of graphical images, text files, as well as Digital Micrograph data files. The program supports both HAADF and annular bright-field (ABF) images.
The functionality and principle of operation of the program are described in:
-
P. Bidenko et al, "Atomic-scale mapper for superlattice photodetectors analysis," Opt. Express 30, 27868-27883 (2022) DOI: 10.1364/oe.461032
Main Features

01
User-friendly GUI
The program’s graphical user interface (GUI), is aimed to give good flexibility of customization while remaining user-friendly.
02
Built-in image filtering and preview
Built-in filtering algorithms (principal component analysis (PCA)-based, brightness normalization, median filter, and fast mean denoise) depend on various parameters. The Atomic Mapper allows previewing of the filtered image before the start of calculation to find the optimal combination of filtering algorithms and their parameters.


Dumbbell
overlay
Atomic
overlay
03
Extraction of coordinates of dumbbells and individual atoms
The material analysis, based on the positions of dumbbells and their brightness is rougher. Analysis of atomic centers can help in the identification of individual atoms, which is extremely useful for the study of interfaces.
04
The flexibility of visualization
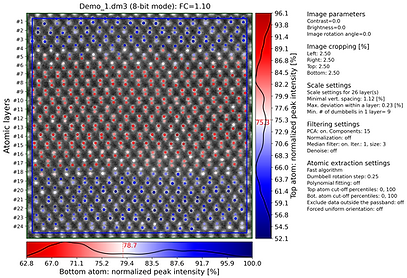
Different parameters of the atoms and dumbbells (peak intensity, mean intensity, intensity difference, atomic spacing, atomic radius) can be visualized using individual color maps.

05
Simplification of results analysis
The divergence point of the color map, which corresponds to the position of transition from one material to another one) can be selected based on the probability distribution, calculated using the kernel density estimation method with the Gaussian kernel.
Downloads
Demo version:
2022-04-18
Atomic Mapper 1.04 Demo.zip
Example 1:
Example 2:
Example 3:
Example 4:
(TEM image with the brightness variation)
Demo_1_v1.02.zip
Demo_2_v1.02.zip
Demo_3_v1.02.zip
Demo_4_v1.02.zip
Example 5:
(TEM image with the dumbbells' shape distortions)
Demo_5_v1.02.zip
Arbitrary input file:
-
Half of the extracted coordinates is not displayed
-
Text files with extracted coordinates are not generated
Images from the provided examples:
-
No limitations of the program's functionality
